How many pets are there in Australia?
There are currently an estimated 28.7 million pets in Australia and we have one of the highest pet ownership rates in the world [1]. Approximately 69% of households in Australia own pets, with dogs being the most common (48%), followed by cats (33%) [1].
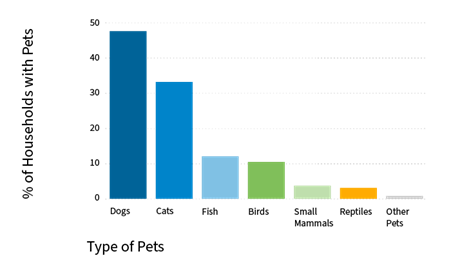
Figure 1. Percentage of households with pets by pet type. Small mammals include rabbits, guinea pigs, ferrets and mice. Reptiles include snakes, turtles, tortoises, lizards, frogs and salamanders [1].
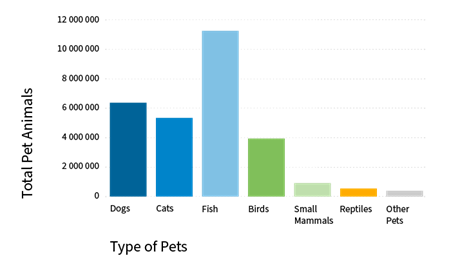
Figure 2. Number of total pet animals by pet type. Small mammals include rabbits, guinea pigs, ferrets and mice. Reptiles include snakes, turtles, tortoises, lizards, frogs and salamanders [1].
What are the characteristics of Australian pet owners?
Seventy five percent of pet owners live in a multi person household, and 82% of pet owners are from households with incomes of $100,000 or more [1].
In 2022, the bond Australians have with their pets has remained strong despite a global pandemic and economic uncertainty. Eight-five percent of owners say their pets have positively impacted their lives. Many pet owners have adopted ‘pet parenting’ behaviours that resemble parent-child relationships – for example, speaking to their pets as though the pet understands what they are saying, and referring to themselves as the pet’s parent [1].
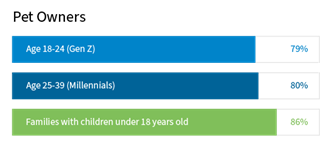
Figure 3. Percentage of pet owners categorised by age in 2022.
The benefits of pet ownership

Common benefits of pet ownership described by pet owners include: [1]
- Relational benefits (love, affection and companionship)
- Improvement of mental health and wellbeing
- Socialisation benefits (e.g., connection to the community and opportunities for human interaction in person or online)
- Improvement of physical health
The reasons for getting pets differs by species but common reasons include companionship, relaxation and mental health and to rescue the animal. [1].
How much do Australians spend on their pets?
Overall, Australian households are estimated to have spent over $33 billion on pet services and products in 2022 with food representing 51% of all expenditure, followed by veterinary service at 14%. [1]. Dog owners spent the most, with an estimated average of $3218 spent per animal each year. Cat owners spend an estimated average of $1715 per animal each year [1]. In 2022, 17% of households with dogs and 12% of households with cats have pet insurance, which has fallen since 2019; the main reasons cited for not having pet insurance was the cost and perceived lack of value.
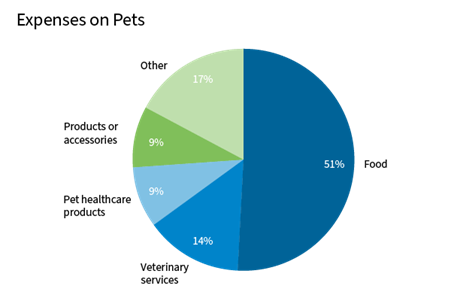
Figure 4. Expenditures by category of product/service in 2022 [1]. ‘Other’ includes grooming, pet insurance, boarding, competitions/memberships, training/behaviour/therapy, transport, alternative healthcare treatments, walking and anything else.
Reference
Animal Medicines Australia (2022) Pets in Australia: A national survey of pets and people (animalmedicinesaustralia.org.au).
Was this article helpful?

This work is licensed under a Creative Commons Attribution-NonCommercial-NoDerivatives 4.0 International License.